

February 2017 Outlook

It’s time to harness the WeatherTrends360 proprietary weather algorithms to see how February of 2017 should play out. But first lets break New Jersey into proper climatological regions. We have the higher elevations of NNJ/NWNJ, the interior coastal plain (SWNJ through CNJ and into NENJ), and the coastal regions (most of SENJ). I’ll be representing each climatological region with a 28-day graph from weathertrends360 data followed by a brief discussion.
Please keep in mind that these algorithms are documented with an 84% verification rate and are based on oceanic water cycles, time table series and very complex mathematics. The best takeaway from this data are general trends (cool vs warm, rainy vs dry, etc). That’s what WeatherTrends360 does best with their proprietary mathematical analysis derived from over 150 years of reactive pattern data.
Higher Elevations of NNJ/NWNJ
(Sussex, Warren, Hunterdon, Morris, N. Somerset, and N. Passaic) – Known for little to no Atlantic Ocean influence, colder-snowier winters, and drier conditions in general when compared to the coast. This region is known to get hot when high pressure sits overhead during the summer and bitterly cold during Arctic outbreaks in the winter. Elevation is a major influence that separates this micro-climate from the rest of New Jersey. This region extends into NE PA (Poconos) and parts of NY State (Catskills).
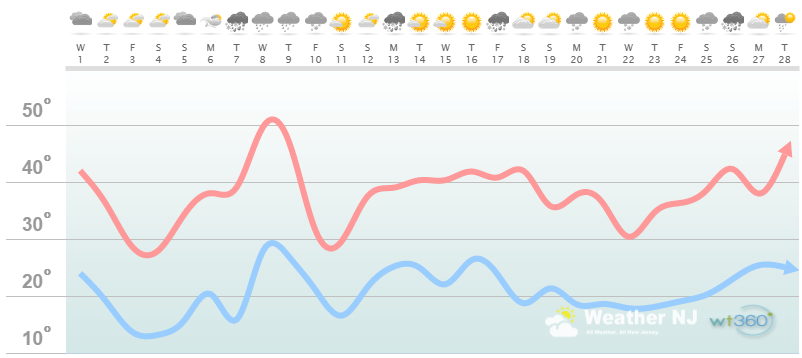
Higher Elevation Discussion: The immediate future is centered around the Feb 6-10 period, currently modeled as stormy. In this period we see the graphs highest temperature spike and one of the lowest points a few days later. After that, temperatures appear very average through the rest of February. Remember though, average for February is still cold. Of the 3 colder pits in temperature, I would take the Feb 3-4 and Feb 10-12 periods seriously as they are front and center in the long range. The third dip in the Feb 26-28 period is likely a bit too far out. Precipitation appears to be average maybe slightly above-average through the month. So average temperatures and average to slightly above-average precipitation for NWNJ.
Interior Coastal Plain from SWNJ-CNJ-NENJ
(Salem, Gloucester, Camden, W. Burlington, Mercer, W. Monmouth, Middlesex, S. Somerset, Union, Essex, Hudson, Bergen, and S. Passaic) – Known for naturally higher temperatures due to lower elevations away from the oceanic influence. This region is also known as “heat island” due to transportation (I-95 corridor), smog, abundant asphalt, concrete, and other man-made substances that naturally absorb and retain heat moreso than natural protected land. This is why excessive heat warnings and air quality alerts are more common in this region. SWNJ always tends to run a few degrees warmer than NENJ but this region is very similar otherwise in micro-climate due to the parallel nature of the Appalachian Mountain elevations to the NW. The same micro-climate can be extended into SE PA and NE MD which tends to run just a little stormier than NJ. This however is what makes up the interior coastal plain.
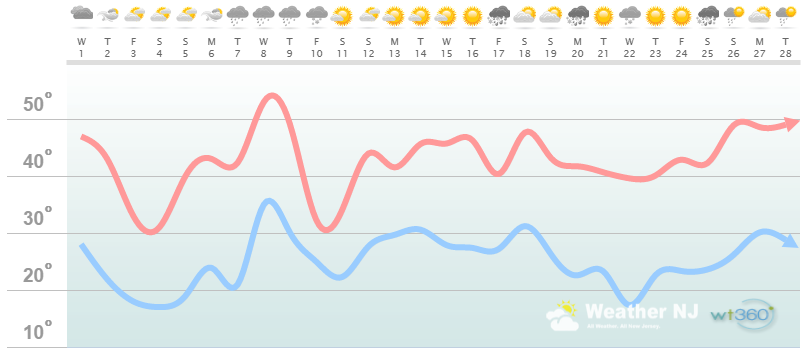
Interior Coastal Plain Discussion: The immediate future is centered around the Feb 6-10 period, currently modeled as stormy. In this period we see the graphs highest temperature spike followed by a temperature crash. After that, temperatures appear very average through the rest of February. Remember though, average for February is still cold. The Feb 3-4 and Feb 10-12 periods appear to be the coldest. Precipitation appears to be average maybe slightly above-average through the month. So average temperatures and average to slightly above-average precipitation for the Newark Basin and interior coastal plain.
Coastal Regions of SENJ
(Cumberland, Cape May, Atlantic, E. Burlington, Ocean, and E. Monmouth) – Known for tremendous influence from the Atlantic Ocean. Oceanic influence keeps this zone cooler in the summer and warmer in the winter than the interior coastal plain and especially the higher elevations of NWNJ. In the summer, sea breeze fronts back into the coast and can ignite thunderstorms if enough instability is present. The cooler marine air slides under the hot air to the W and provides additional atmospheric lifting. This is both why it’s 5-15 degrees cooler at the shore than the Philly-Trenton area and why near-stationary thunderstorms can form along the coast capable of producing localized flash flooding. In the winter, the ocean is warmer than interior regions which plays a huge role in rain vs. snow—highly dependent on wind direction. When the winds chance from NE to N/NE, that’s usually when temps crash and change rain over to snow. Regardless, this micro-climate is well known, well documented and well expressed. This region extends into most of Delaware as well.
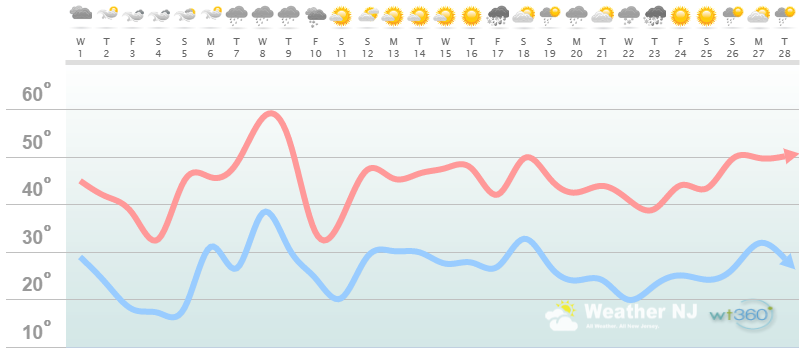
Coastal Region Discussion: The immediate future is centered around the Feb 6-10 period, currently modeled as stormy. In this period we see the graphs highest temperature spike followed by a temperature crash. After that, temperatures appear very average through the rest of February. Remember though, average for February is still cold. The Feb 3-4 and Feb 10-12 periods appear to be the coldest. Precipitation appears to be average maybe slightly above-average through the month. So average temperatures and average to slightly above-average precipitation for the immediate coastal plain.
Additional Nerdy Disco: I’m watching a few wildcard dynamics.
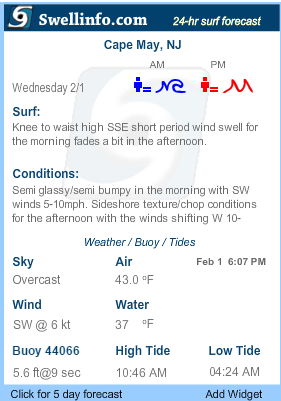
First, Sea Surface Temperatures (SST) are bottoming out for the year. The buoy off Cape May is reading 37F. February is New Jersey’s wintriest month, especially with regard to coastal storms. Now, when an easterly wind component or fetch comes off the ocean, the lower levels can chill down to 32F or below much quicker than the December/January 40F+ coastal air. Here’s the data from the Cape May buoy:
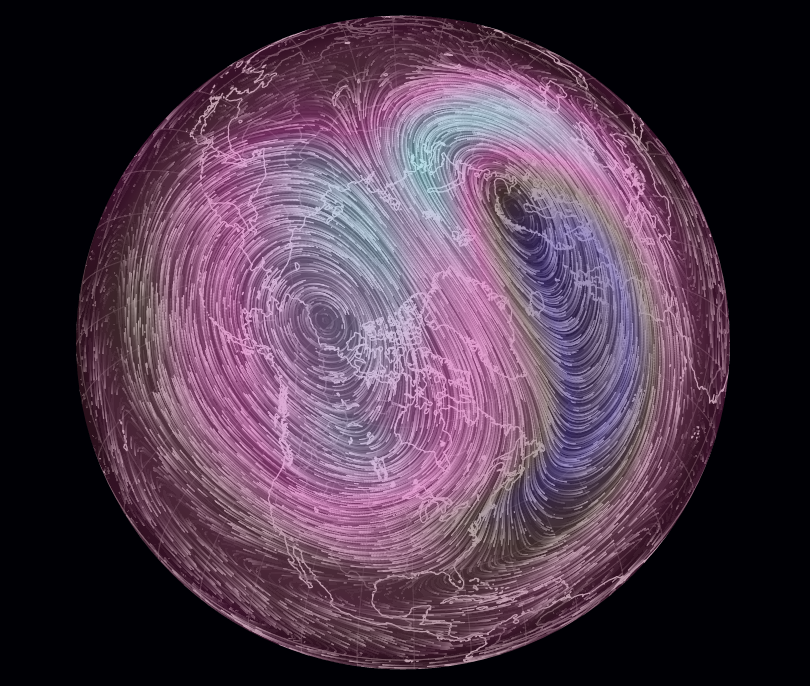
Second, is a Sudden Stratospheric Warming Event (SSWE). This is when the stratosphere warms over the N Pole and displaces (sometimes splits) the colder troposphere below into to the lower latitudes of the northern hemisphere. That’s when we usually see a lobe of the polar vortex swing through the CONUS. The warming is occurring now so we could possibly take a turn for the colder if, and only if, the SSWE displaces the troposphere properly. This usually happens about a week or two after the warming. Here’s a current snapshot of 10mb over the N Pole. The purple area represents a colder stratosphere (warmer underneath). This is the air mass that kept January on the warmer side. The lighter blue and pink represent a warmer stratosphere (colder underneath). As the stratosphere thickens with warmth, the colder troposphere should, in theory, push down into the US. We’ll see in about 7-10 days:
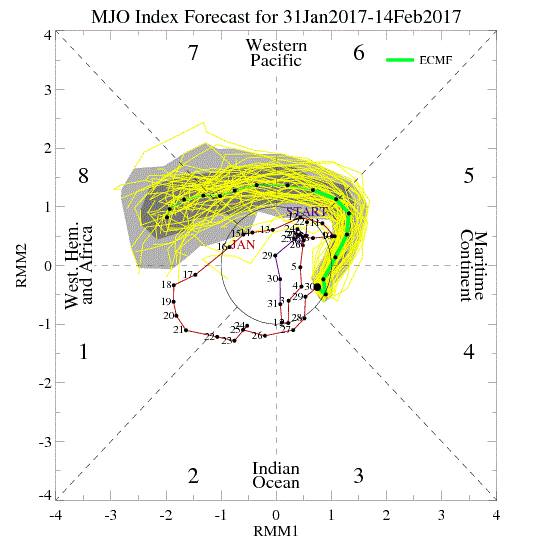
Last, is the Madden Julian Oscillation (MJO). This is an oscillation based on the greatest tropical forcing along the equator in the Western to Central Pacific. When the best forcing is oriented near the Pacific dateline, it can throw heights into the W US in the form of a positive Pacific North American (PNA) oscillation. This propagates downstream as an Eastern US trough. Overall, it results in a pattern more favorable for winter storm development. The MJO is currently modeled strongly to go into phase 8 in February which would create this ideal forcing position:

Weathertrends360 is a complete, global, web solution to help retailers and suppliers capitalize on the weather and its influence on sales and marketing plans up to a year ahead. Learn how to become PROACTIVE vs REACTIVE with the weather in every phase of your business – how much inventory to buy/produce, where to allocate more/less, when to run weather-optimized advertising/marketing campaigns – weathertrends360 can help you determine all of this in minutes! 84% independently audited accuracy for both short-term and year-ahead forecasts for temperature and precipitation.
In English: Overall, we’re looking at average temperatures (highs ranging from 38-44 and lows ranging from 18-29). We’re also looking at average to slightly above-average precipitation for February. We’re not discussing specific threats here, just the most likely trends. I’m watching a few wildcard dynamics that if seen to fruition would result in temperatures colder than expected. I’ll write about such if it happens but if not, let’s just stick with the going forecast. Everyone have a wonderful February 2017 and please be safe! Be safe! JC
Jonathan Carr (JC) is the founder and sole operator of Weather NJ, New Jersey’s largest independent weather reporting agency. Since 2010, Jonathan has provided weather safety and forecasting services for New Jersey and immediate surrounding areas through the web, social media, and app spaces. Originally branded as Severe NJ Weather (before 2014), Weather NJ is proud to bring you accurate and responsible discussions ahead of high-stakes weather scenarios that impact the garden state. All Weather. All New Jersey.™


LOCAL FORECAST | INTERACTIVE RADAR | LATEST NJ WEATHER ALERTS | WEDDING FORECAST| PRIVACY POLICY
© Copyright 2024 Weather NJ LLC. All Rights Reserved.
Some information that can be found on our website is provided by a private weather station and is not an officially recognized station for weather reporting. Though we always strive to achieve accurate reporting for our own use, it is important that you do NOT depend on the data provided here for any purpose.
