

August 2015 Outlook

It’s time to use the crystal ball and harness the WeatherTrends360 proprietary weather algorithms for a look at August 2015. But first lets break New Jersey into proper climatological regions. We have the upper elevations of NNJ/NWNJ, the interior coastal plain (SWNJ through CNJ and into NENJ), and the coastal regions (most of SENJ). I’ll be representing each climatological region with a 28-day graph from weathertrends360 data followed by a brief discussion. Please keep in mind that these algorithms are documented with an 84% verification rate and are based on oceanic water cycles and time table series.
Higher Elevations of NNJ/NWNJ
(Sussex, Warren, Hunterdon, Morris, N. Somerset, and N. Passaic) – Known for little to no Atlantic Ocean influence, colder-snowier winters, and drier conditions in general when compared to the coast. This region is known to get hot when high pressure sits overhead during the summer and bitterly cold during Arctic outbreaks in the winter.
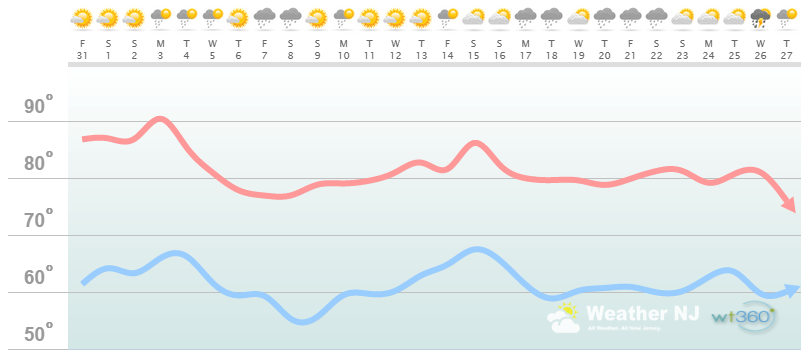
Discussion: The warmer peak-summer weather should make a noticeable change after a rain and stormy period surrounding August 3-5. After that, high temperatures should drop to near-average/slightly below average for the rest of the month. For this region, that’s about upper-70s/lower-80s. We’re looking at a short rainy period between August 7-8 and then a longer rainy period between August 17-22. The rest of the month and in-between looks pretty dry.
Interior Coastal Plain from SWNJ-CNJ-NENJ
(Salem, Gloucester, Camden, W. Burlington, Mercer, W. Monmouth, Middlesex, Union, Essex, Hudson, Bergen, and S. Passaic) – Known for naturally higher temperatures due to lower elevations away from the oceanic influence. This region is also known as “heat island” due to transportation (I-95 corridor), smog, abundant asphalt, concrete, and other man-made substances that naturally absorb and retain heat moreso than natural protected land.
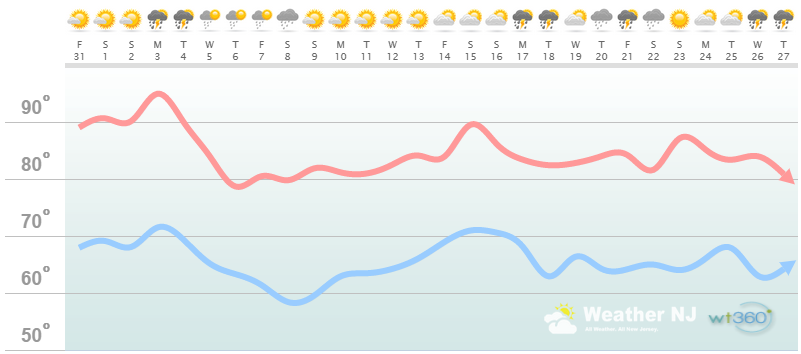
Discussion: The warmer peak-summer weather should make a noticeable change after a stormy period surrounding August 3-4. On-and-off rain showers could linger until about the 8th. After that, high temperatures should fluctuate between near-average to slightly above average for the rest of the month. For this region, that’s in the low-to-mid 80s. Interior urban areas such as Philadelphia- Trenton have the best chance of seeing a few 90-degree days in the August 14-16 period and maybe again near the 23rd. We’re looking at a few rainy and/or stormy periods in the second half of the August. The rest of the month and in-between looks pretty dry.
Coastal Regions of SENJ
(Cumberland, Cape May, Atlantic, E. Burlington, Ocean, and E. Monmouth) – Known for tremendous influence from the Atlantic Ocean. Oceanic influence keeps this zone cooler in the summer and warmer in the winter than the interior coastal plain and especially the higher elevations of NWNJ. This forms a micro-climate that only local inhabitants and frequent visitors are familiar with.
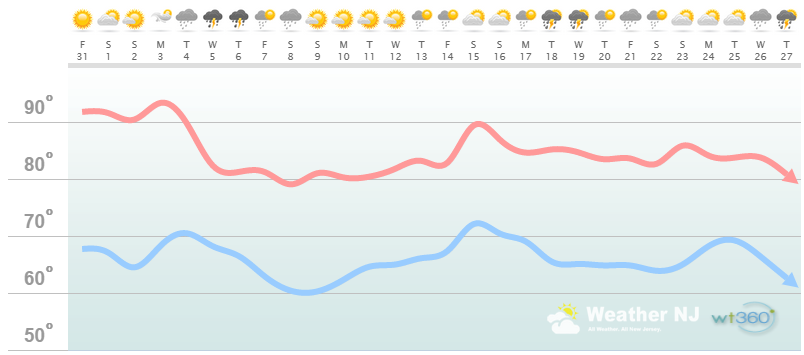
Discussion: The warmer peak-summer weather should make a noticeable change after a stormy period surrounding August 3-4. On-and-off rain showers could linger until about the 8th. After that, high temperatures should fluctuate between near-average to slightly above average for the rest of the month. For this region, that’s in the low-to-mid 80s. There could be a few 90-degree flirtations near the August 15th and 23rd periods. We’re looking at a few rainy and/or stormy periods in the second half of the August. The rest of the month and in-between looks pretty dry.
Also keep in mind that immediate coastal areas are subject to sea breeze frontal surface boundaries that back in off the ocean. These tend to happen in the afternoon hours, during peak diurnal heating, and render affected coastal portions the same temperature as the ocean surface for the rest of the afternoon-evening. Right now, the ocean is ranging in temperature (F) from 73-76 (Sandy Hook to Cape May). So on an 80-90 day inland, this mechanism is what provides the “natural air conditioning” feeling that many shore-goers generally adore. It also makes “those who like it hot” pack up for the day lol. Regardless, it can result in a drastic temperature difference between the coast and interior. I’ll post radar clutter imagery and the Rutgers temperature maps when I see one backing in off the Atlantic Ocean. This is my favorite NJ micro-climate mechanism and it sometimes can enhance thunderstorm development.
In English: Everyone should be warm until about August 5th. Then all regions drop in high temperature to 70s and 80s with just a handful of 90-degree dog days of August. The common theme is below-average rainfall the first half of August and then average to above-average rainfall the second half.
Thunderstorm activity is traditionally reduced in the month of August. Ocean temperatures will continue to climb as the overall atmosphere equalizes into a warmer state at all levels. With that said, there should be plenty of afternoon pop-ups and pre-frontal storm activity but no where near what traditionally occurs between May and July. I’m sure you’ve noticed this trend if you’ve lived in New Jersey for a while. All regions also indicate another drop in temperatures towards the end of August but that’s also expected as we begin to knock on Autumn’s door.
Tropical activity is the unforeseen caveat which cannot be detected until about 7-10 days from formation using global model guidance. We’re nearing peak hurricane season so its time to start paying attention to anything that comes off the west coast of Africa as well as closer developments in the Gulf of Mexico and Bahamas/Caribbean. Should that happen, I’ll be on it immediately. Otherwise, a great August is predicted!
Weathertrends360 is a complete, global, web solution to help retailers and suppliers capitalize on the weather and its influence on sales and marketing plans up to a year ahead. Learn how to become PROACTIVE vs REACTIVE with the weather in every phase of your business – how much inventory to buy/produce, where to allocate more/less, when to run weather-optimized advertising/marketing campaigns – weathertrends360 can help you determine all of this in minutes! 84% independently audited accuracy for both short-term and year-ahead forecasts for temperature and precipitation.
A forecast Weather Trends issued one year ago is more accurate than every other weather company’s 5 to 14-day forecasts. The University of Miami and West Point PhD Climatologist’s prove WTI’s year-ahead forecasts are several times more accurate than NOAA – Click to Download Report. Also check out their free txt and email alerts!
Enjoy the month of July and please be safe! JC
Jonathan Carr (JC) is the founder and sole operator of Weather NJ, New Jersey’s largest independent weather reporting agency. Since 2010, Jonathan has provided weather safety discussion and forecasting services for New Jersey and surrounding areas through the web and social media. Originally branded as Severe NJ Weather (before 2014), Weather NJ is proud to bring you accurate and responsible forecast discussion ahead of high-stakes weather scenarios that impact this great garden state of ours. All Weather. All New Jersey.™ Be safe! JC


LOCAL FORECAST | INTERACTIVE RADAR | LATEST NJ WEATHER ALERTS | WEDDING FORECAST| PRIVACY POLICY
© Copyright 2026 Weather NJ LLC. All Rights Reserved.
Some information that can be found on our website is provided by a private weather station and is not an officially recognized station for weather reporting. Though we always strive to achieve accurate reporting for our own use, it is important that you do NOT depend on the data provided here for any purpose.
