

January Discussion with WeatherTrends360

It’s time to harness the WeatherTrends360 proprietary weather algorithms to see how the rest of January 2019 should play out. But first lets break New Jersey into climatologically-similar regions. We have the higher elevations of NNJ/NWNJ, the interior coastal plain and Newark Basin (SWNJ through CNJ and into NENJ), and the coastal regions (most of SENJ coast – Sandy Hook down and around Cape May into Delaware Bay). I’ll be representing each climatological region with a 28-day graph from weathertrends360 data followed by a brief discussion.
Please keep in mind that these algorithms are documented with an 84% verification rate and are based on oceanic water cycles, time table series and very complex mathematics. The best takeaway from this data are general trends (cool vs warm, rainy vs dry, etc). I’m always hesitant to forecast specific surface conditions (rainfall amounts, snowfall amounts, winds, etc) beyond the 7 -day forecasting period. But temperature and precipitation trends are what WeatherTrends360 does best with their proprietary mathematical analysis derived from over 150 years of reactive pattern data. For this reason, let’s call this a long-range discussion of expectations rather than a locked-in long-range forecast.
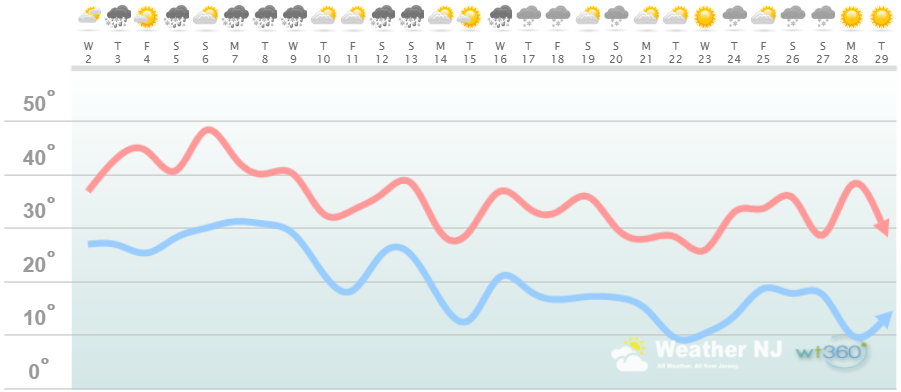
Higher Elevations of NNJ/NWNJ
(Sussex, Warren, Hunterdon, Morris, N. Somerset, and N. Passaic) – Known for little to no Atlantic Ocean influence, colder-snowier winters, and drier conditions in general when compared to the coast. This rnown to get hot when high pressure sits overhead during the summer and bitterly cold during Arctic outbreaks in the winter. Elevation is a major influence that separates this micro-climate from the rest of New Jersey. This region extends into NE PA (Poconos) and parts of NY State (Catskills).
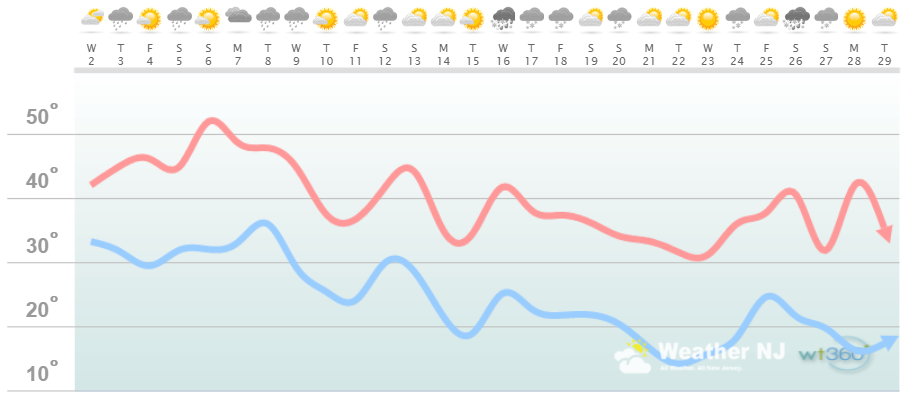
Interior Coastal Plain and Newark Basin from SWNJ-CNJ-NENJ
(Salem, Gloucester, Camden, W. Burlington, Mercer, W. Monmouth, Middlesex, S. Somerset, Union, Essex, Hudson, Bergen, and S. Passaic) – Known for naturally higher temperatures due to lower elevations away from the oceanic influence. This region is also known as “heat island” due to transportation (I-95 corridor), smog, abundant asphalt, concrete, and other man-made substances that naturally absorb and retain heat moreso than natural protected land. This is why excessive heat warnings and air quality alerts are more common in this region. SWNJ always tends to run a few degrees warmer than NENJ but this region is very similar otherwise in micro-climate due to the parallel nature of the Appalachian Mountain elevations to the NW. The same micro-climate can be extended into SE PA and NE MD which tends to run just a little stormier than NJ. This however is what makes up the interior coastal plain.
Coastal Regions of SENJ
(Cumberland, Cape May, Atlantic, E. Burlington, Ocean, and E. Monmouth) – Known for tremendous influence from the Atlantic Ocean. Oceanic influence keeps this zone cooler in the summer and warmer in the winter than the interior coastal plain and especially the higher elevations of NWNJ. In the summer, sea breeze fronts back into the coast and can ignite thunderstorms if enough instability is present. The cooler marine air slides under the hot air to the W and provides additional atmospheric lifting. This is both why it’s 5-15 degrees cooler at the shore than the Philly-Trenton area and why near-stationary thunderstorms can form along the coast capable of producing localized flash flooding. In the winter, the ocean is warmer than interior regions which plays a huge role in rain vs. snow—highly dependent on wind direction. When the winds chance from NE to N/NE, that’s usually when temps crash and change rain over to snow. This region extends into most of Delaware as well.
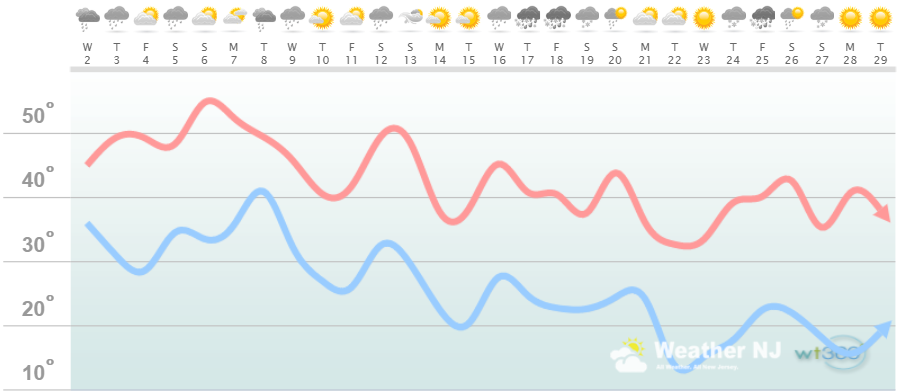
Discussion: The common theme for all of NJ is a colder second 2/3 of January. The turning point seems like Jan 10 which aligns with the tropospheric propagation of the current stratospheric warming and Polar Vortex split. We have a very zonal pattern in the upper-levels due to a raging Pacific jet. This jet can either tap the warmer sub-tropical origins or the colder Arctic. For the first 10 days or so of January it looks like the former. For the second 2/3 of January it looks like the latter due to the polar vortex influence. The only warmer anomaly after Jan 10 appears to be the Jan 12-13 period. The following image represents current 10mb (stratosphere) wind currents.
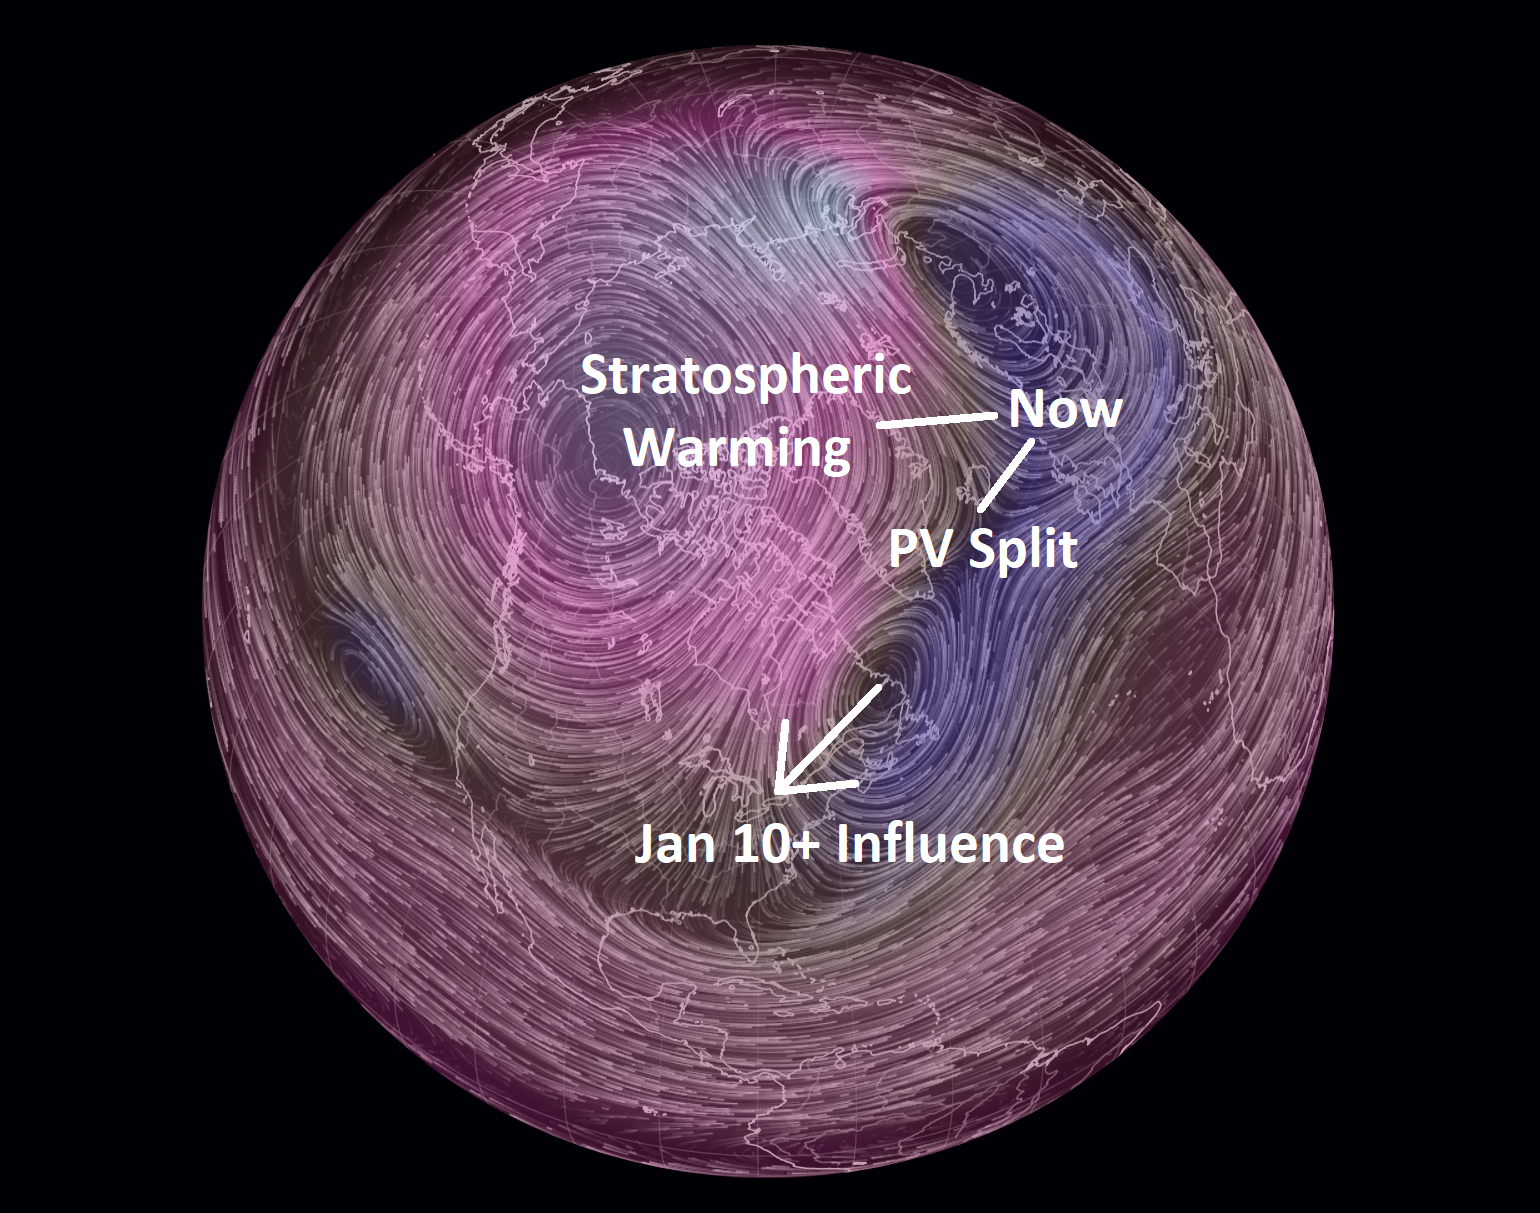
The warming area came in on the front side of the stratospheric high and split the PV into two vortices. The lower vortex (closest to NJ) is the PV piece of interest. That vortex is modeled to meander in its current location for about another week before tracking into the NE US for the expected Jan 10-forward influence. The air that wraps around the back side of that stratospheric vortex should inject some of the planets coldest air mass into the Pacific jet and take our temperatures down. As you can see in the above WeatherTrends360 charts, even places like Cape May go down into the teens overnight with statewide highs failing to escape the low-to-mid 30s. It’s not record cold but its a prolonged period of pretty darn cold. As far as precipitation goes there are many opportunities for wintry type. The pattern is active and I do not see that changing. The first 10 days of January will likely be on the mild side meaning mostly rain for most of NJ. But after Jan 10 we should have some real shots of statewide snowfall.
In English: Today through ~Jan 10 looks relatively mild for mid-winter. NNJ elevations could see some mixed/wintry precipitation tomorrow but aside from that rainfall is most likely. Jan 10-forward (aside from a warmer Jan 12-13 reload) then looks to feature prolonged below-average temperatures thanks to Polar Vortex influence. Remember we’re in the coldest month of the year so below-average temperatures are considered pretty darn cold. I expect rainfall for most of NJ until Jan 10 and various snowfall opportunities once we make the turn colder.

Weathertrends360 is a complete, global, web solution to help retailers and suppliers capitalize on the weather and its influence on sales and marketing plans up to a year ahead. Learn how to become PROACTIVE vs REACTIVE with the weather in every phase of your business – how much inventory to buy/produce, where to allocate more/less, when to run weather-optimized advertising/marketing campaigns – weathertrends360 can help you determine all of this in minutes! 84% independently audited accuracy for both short-term and year-ahead forecasts for temperature and precipitation.
Jonathan Carr (JC) is the founder and sole operator of Weather NJ, New Jersey’s largest independent weather reporting agency. Since 2010, Jonathan has provided weather safety discussion and forecasting services for New Jersey and surrounding areas through the web and social media. Originally branded as Severe NJ Weather (before 2014), Weather NJ is proud to bring you accurate and responsible forecast discussion ahead of high-stakes weather scenarios that impact this great garden state of ours. All Weather. All New Jersey.™ Be safe! JC


LOCAL FORECAST | INTERACTIVE RADAR | LATEST NJ WEATHER ALERTS | WEDDING FORECAST| PRIVACY POLICY
© Copyright 2026 Weather NJ LLC. All Rights Reserved.
Some information that can be found on our website is provided by a private weather station and is not an officially recognized station for weather reporting. Though we always strive to achieve accurate reporting for our own use, it is important that you do NOT depend on the data provided here for any purpose.
