

June 2019 Discussion with WeatherTrends360

It’s time to harness WeatherTrends360 technology and look at how the rest of June 2019 should play out. WeatherTrends360 algorithms are documented with an 84% verification rate and are based on oceanic water cycles, time table series and very complex mathematics. The best takeaway from this data are general trends (cool vs warm, rainy vs dry, etc). I’m always hesitant to forecast specific surface conditions (rainfall amounts, snowfall amounts, winds, etc) beyond the 7 -day forecasting period. But temperature and precipitation trends are what WeatherTrends360 does best with their proprietary mathematical analysis derived from over 150 years of reactive pattern data. For this reason, let’s call this a long-range discussion of expectations rather than a locked-in long-range forecast.

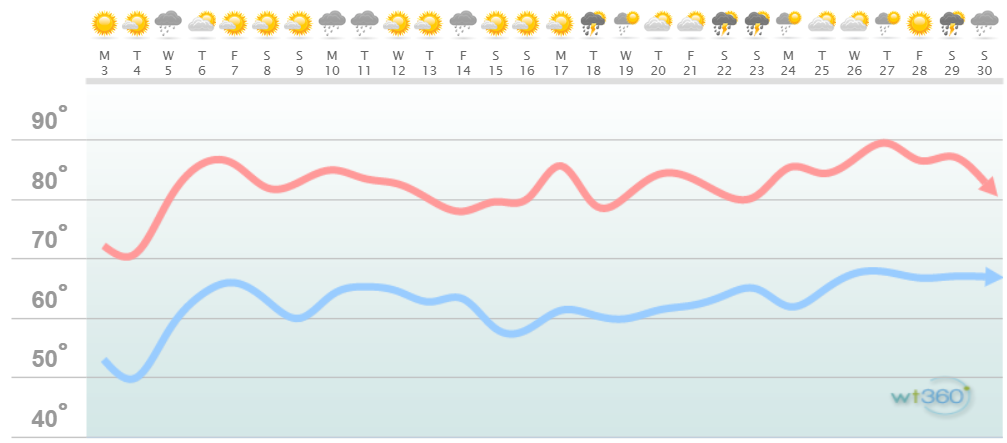
The following diagram is calculated for the meat and potatoes of New Jersey in general. Please keep in mind that micro-climate influences can vary. NWNJ elevations and immediate coastal areas, for example, will likely verify slightly cooler than illustrated due to elevation and marine flow influence. Interior CNJ/SNJ (closer to Philly/Trenton) slightly warmer than illustrated. But for most of New Jersey this diagram should suffice for the general idea of temperature and precipitation trend analysis.
Discussion: We had quite an active May. I can’t remember seeing so many damaging wind and hail reports in years. The upper-jet remained in close proximity to NJ and we’ve simply had system after system move over us. Things look to relax a bit for June with the upper-jet behaving a bit more normal. That means it will lift N of NJ and allow for hot/humid ridges to build with the occasional cold frontal passage cooling/drying things out for a a few days. Colder upper-level troughs should be shorter-lived from this point on. We’re basically at/near peak sun-angle for the year and we’ll be there for most of June. That means that even a cold upper-level trough from Canada still feels amazing. Also look for ocean temperatures to warm to near-room temperature values. That means that onshore flow will no longer feel too cold. Give it until closer to the end of the month for that. Don’t get me wrong there will be rain from either synoptic organization or frontal/warm sector thunderstorm development. And those thunderstorms can produce severe conditions given the right setup. I just don’t see June 2019 being as wet as the pattern that dominated most of the year so far.
Another cool thing to look for are sea breeze fronts. They form from hot rising air inland which forces sinking air over the ocean and completes the flow cycle of onshore flow off the ocean. These fronts act as natural air conditioning and sometimes fuel the lifting needed for thunderstorm development. Sea breeze fronts tend to form in the early-afternoon and are visible on radar clutter.
Also an interesting thing is the heat island effect of the concentrated I-95 corridor. From DC through NYC you will notice that areas about 10-20 miles on either side of the general I-95 corridor will stay warmer overnight. That is because concrete, buildings and paved surfaces hold heat longer while surrounding areas with more natural surfaces cool normally.
Overall look for average precipitation and average temperatures for the month of June.
In English: June 2019 looks to feature average temperatures and average precipitation/thunderstorm activity.

Jonathan Carr (JC) is the founder and sole operator of Weather NJ, New Jersey’s largest independent weather reporting agency. Since 2010, Jonathan has provided weather safety discussion and forecasting services for New Jersey and surrounding areas through the web and social media. Originally branded as Severe NJ Weather (before 2014), Weather NJ is proud to bring you accurate and responsible forecast discussion ahead of high-stakes weather scenarios that impact this great garden state of ours. All Weather. All New Jersey.™ Be safe! JC


LOCAL FORECAST | INTERACTIVE RADAR | LATEST NJ WEATHER ALERTS | WEDDING FORECAST| PRIVACY POLICY
© Copyright 2026 Weather NJ LLC. All Rights Reserved.
Some information that can be found on our website is provided by a private weather station and is not an officially recognized station for weather reporting. Though we always strive to achieve accurate reporting for our own use, it is important that you do NOT depend on the data provided here for any purpose.
