

Long-Range WeatherTrends360 Outlook

It’s time to harness WeatherTrends360 technology and look at how the rest of August 2020 should play out as well as an early look at the first half of September 2020. WeatherTrends360 algorithms are documented with an 84% verification rate and are based on oceanic water cycles, time table series and very complex mathematics. The best takeaway from this data are general trends (cool vs warm, rainy vs dry, etc). I’m always hesitant to forecast specific surface conditions (rainfall amounts, snowfall amounts, winds, etc) beyond the 7 -day forecasting period. But general temperature and precipitation trends are what WeatherTrends360 does best with their proprietary mathematical analysis derived from over 150 years of reactive pattern data. For this reason, let’s call this a long-range discussion of reasonable expectations rather than a locked-in long-range forecast. You’ll never see me commit to specific surface conditions outside of the 7-day forecasting period.

The following diagram is calculated using WeatherTrends360 proprietary algorithms for New Jersey in general. Please keep in mind that micro-climate influences can vary. NWNJ elevations and SNJ Pine Barrens (away from the ocean), for example, will verify slightly colder than illustrated due to elevation and soil heat exchange. Interior CNJ/SNJ (closer to N Delaware/Philly/Trenton – I-95 corridor into NENJ) slightly warmer than illustrated due to urban heat island effect and several other influencing factors. All areas of NJ however would have similar graph trends and sky conditions. It’s best to let the following graph paint an overall picture (trends) instead of focusing on the low-level specific condition details.
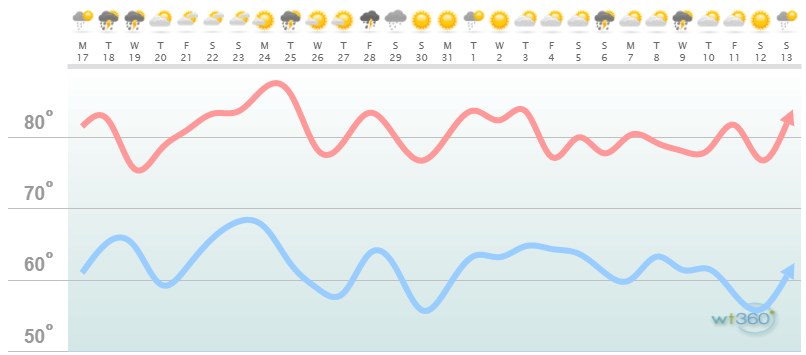
Discussion: As the above chart indicates we see a period of relief this week before temperatures rebound and moderate for later this weekend into next week. We’re then looking at a fairly uneventful roller-coaster of temperatures alternating between warm and humid and cooler and drier. I think we are through with the oppressive heat and humidity that’s been present since just after the July 4th period. This was because the Bermuda high was stubbornly locked over Bermuda—sending persistent SW flow into at least CNJ and SNJ. Only NNJ saw a few transient periods of relief. But now we’re going to start to see a downward trend in temperatures. The next 30 days or so do not feature any days reaching above 90 except maybe towards the end of this weekend (Aug 23-25). But it looks like a solid cold front of relief should occur just after that period. Hurricane season has my top concern right now. Currently there are no tropical threats to NJ but we all know that can change inside every 7-day forecasting period so I will be watching. The tropics are active but most action is too far S to impact NJ at least directly.

In English: The next 30 days look cooler than the previous 30, that’s for sure. Lower humidity and temps likely struggling to reach above 90 (outside of interior CNJ/SNJ in the Aug 23-25 period). I’d say temperatures still look slightly above-average despite that still being cooler than what we’ve become used to since ~July 4th. Precipitation looks slightly lower than average for this upcoming 30 days. Most rain will be achieved via showers and thunderstorms generated from instability or frontal action. Larger synoptic storm systems could change this but none are currently showing. Should they crop-up in the 7-day forecasting period we’ll be discussing it. Everyone have a great rest of your August and get ready for the pumpkin-spiced latte weather conditions that should star showing up on some of the colder nights (dips in above graph). Be safe! JC
Jonathan Carr (JC) is the founder and sole operator of Weather NJ, New Jersey’s largest independent weather reporting agency. Since 2010, Jonathan has provided weather safety discussion and forecasting services for New Jersey and surrounding areas through the web and social media. Originally branded as Severe NJ Weather (before 2014), Weather NJ is proud to bring you accurate and responsible forecast discussion ahead of high-stakes weather scenarios that impact this great garden state of ours. All Weather. All New Jersey.™ Be safe! JC


LOCAL FORECAST | INTERACTIVE RADAR | LATEST NJ WEATHER ALERTS | WEDDING FORECAST| PRIVACY POLICY
© Copyright 2026 Weather NJ LLC. All Rights Reserved.
Some information that can be found on our website is provided by a private weather station and is not an officially recognized station for weather reporting. Though we always strive to achieve accurate reporting for our own use, it is important that you do NOT depend on the data provided here for any purpose.
