

May 2020 Outlook

It’s time to harness WeatherTrends360 technology and look at how the rest of May 2020 should play out. WeatherTrends360 algorithms are documented with an 84% verification rate and are based on oceanic water cycles, time table series and very complex mathematics. The best takeaway from this data are general trends (cool vs warm, rainy vs dry, etc). I’m always hesitant to forecast specific surface conditions (rainfall amounts, snowfall amounts, winds, etc) beyond the 7 -day forecasting period. But general temperature and precipitation trends are what WeatherTrends360 does best with their proprietary mathematical analysis derived from over 150 years of reactive pattern data. For this reason, let’s call this a long-range discussion of reasonable expectations rather than a locked-in long-range forecast. You’ll never see me commit to specific surface conditions outside of the 7-day forecasting period.

The following diagram is calculated using WeatherTrends360 proprietary algorithms for New Jersey in general. Please keep in mind that micro-climate influences can vary. NWNJ elevations and SNJ Pine Barrens (away from the ocean), for example, will verify slightly colder than illustrated due to elevation and soil heat exchange. Interior CNJ/SNJ (closer to N Delaware/Philly/Trenton – I-95 corridor into NENJ) slightly warmer than illustrated due to urban heat island effect and several other influencing factors. All areas of NJ however would have similar graph trends and sky conditions. It’s best to let the following graph paint an overall picture (trends) instead of focusing on the low-level specific condition details.
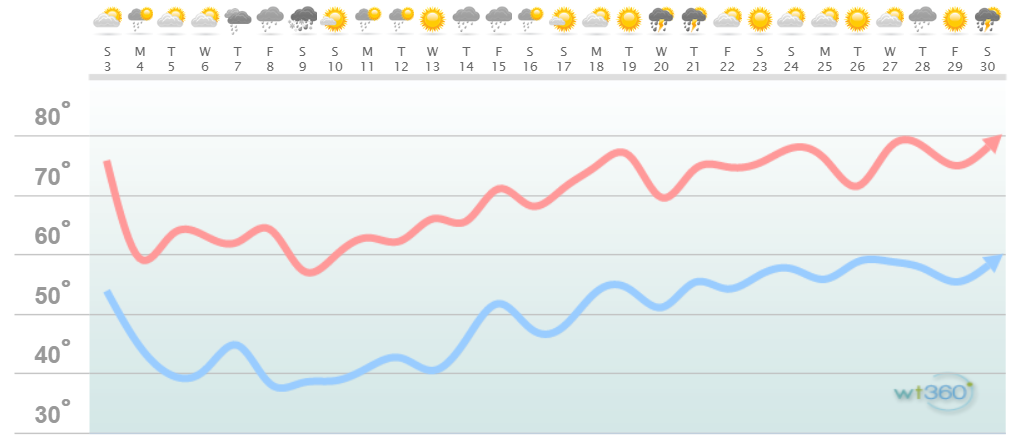
Discussion: Even though we’re currently (May 3) inside a transient mild period, a cooler pattern has dominated April and will likely spill over well into May. The Pacific Ocean pattern should continue to support ridges for the W side of N America which in-turn supports troughs for the E side of N America. I do see some blocking in the Greenland area (-NAO) but nothing crazy. The W US ridging (+PNA) seems to be driving this. As the WeatherTrends360 algorithms suggest, we could be looking at a cool first 2/3 of May with the May 8-12 period looking like the coldest.
It’s important to note that below average for May is not exactly cold like winter. We’re talking highs in the mid-to-upper 50s for a few days with most days in the lower-60s. No need to run the sinks to avoid pipe bursts. But for sure, an annoying nuisance in a time when most would like to embrace outdoor activities. The last third of May looks to be warmer but not exactly hot. Could we see a transient heat wave? Sure. But overall, temperatures in the last third of May could end up how you’d want April to ultimately be…if that makes sense seasonally. Regarding precipitation, the first half of May appears to be wetter than the second half. The severe weather season has been off to a strong start so we’ll have to watch any frontal systems that make sense to watch regarding wind damage potential.

In English: Per the algorithms of WeatherTrends360, temperatures look below-average for the first 2/3 of May and near-average for the last third. Precipitation looks near to slightly-above average for the first half of May and near to slightly-below average for the second half. Everyone have yourself a great May and please be safe! JC
Jonathan Carr (JC) is the founder and sole operator of Weather NJ, New Jersey’s largest independent weather reporting agency. Since 2010, Jonathan has provided weather safety discussion and forecasting services for New Jersey and surrounding areas through the web and social media. Originally branded as Severe NJ Weather (before 2014), Weather NJ is proud to bring you accurate and responsible forecast discussion ahead of high-stakes weather scenarios that impact this great garden state of ours. All Weather. All New Jersey.™ Be safe! JC


LOCAL FORECAST | INTERACTIVE RADAR | LATEST NJ WEATHER ALERTS | WEDDING FORECAST| PRIVACY POLICY
© Copyright 2026 Weather NJ LLC. All Rights Reserved.
Some information that can be found on our website is provided by a private weather station and is not an officially recognized station for weather reporting. Though we always strive to achieve accurate reporting for our own use, it is important that you do NOT depend on the data provided here for any purpose.
