

Weather NJ 2016-2017 Winter Primer

This article is intended to be educational rather than predictive. If you’re looking for the latter, check out the EPAWA 2016-2017 Winter Outlook for a comprehensive look at current global observations, what they’ve historically led to and our best guess at what will actually happen this winter. Both articles are very deep meteorological dives for those with basic weather knowledge but I try to break it all down the best I can. I can assure you that if you read both, you’ll be extremely prepared for this winter. I advise making a cup of coffee (or similar vice) and getting comfortable should you choose to proceed with either. Let’s begin…
Jet Stream – A jet stream is an area of concentrated winds in the upper-atmosphere (most are located ~250mb or 34,000 feet give or take). These winds form channels that wrap around the planet. There are several jet streams in each hemisphere but we’re mostly influenced by the polar jet to our north and sub-tropical jet to our south. Sometimes a jet can split into to. Sometimes we see a Pacific jet. Above the polar jet is very cold air. Below the sub-tropical jet is very warm and moist air. In between is mild air. The jet streams are constantly shifting along their x and y axis, visually seen as wobbles. When the wobbles bunch up together, they create very active weather conditions (meridional flow pattern). When the wobbles flatten, they create less active weather conditions (zonal flow pattern).
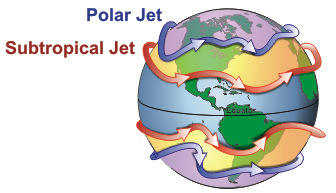
Because the winds wrap around the planet, consider their total length physically bound to a finite length. Therefore, if numerous wobbles bunch up on one side of the planet into a meridional flow pattern, the jet stream will straighten into a zonal flow pattern elsewhere around the planet. So for us to get major winter storms, we want to see a bunch of wobbles over the E. Pacific and continental US in a specific configuration. In general, when the jet stream moves across the surface of the planet, it creates active weather conditions. The more wobbles, the more active and intense the surface weather conditions become.
Cyclone vs. Anticyclone – In the northern hemisphere, low pressure organizes into counter-clockwise cyclones. This is due to the Coriolis effect. Because of Earth’s spin, anything moving through the atmosphere north or south is subject to wander azimuth drift. If you threw a football from the Equator to the North Pole, the trajectory would not be a straight line. It would be a curve to the east. Converging air towards the center of low pressure is bound to the same physics as the football. Therefore the air meets as a propeller at the point of convergence, not like a plus sign. In the northern hemisphere, this creates counter-clockwise cyclones. In the southern hemisphere, it creates clockwise cyclones. To better understand that, spin a globe and view it from the north pole, then flip it and view it from the south pole. And to address a frequently asked-about rumor, no it does not affect a toilet bowl flush. You need a much larger area of convergence (hundreds of miles) to create the Coriolis affect. The cyclonic nature of a toilet bowl flush is determined by the angle of water flow within the bowl.
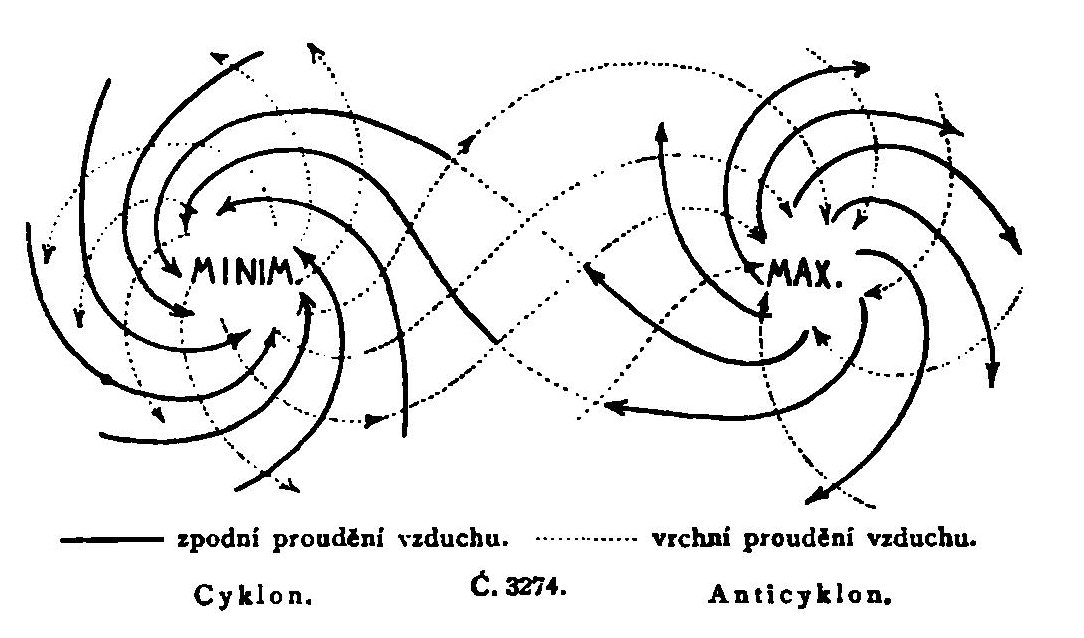
Anyway, when you suck through a straw, your drink lifts upwards because of the low pressure generated in your mouth. The atmosphere works the same way. Low pressure creates lifting (convergence at the lower levels and divergence at the upper levels) which creates precipitation. The counter-clockwise flow around the center of the low governs wind direction at the surface and air mass temperature movement. Lows can be upper-level (often at the heart of a trough) or surface level (the kind that like to form along jet streams). Whether the system be a hurricane, mid-latitude cyclone, extratropical cyclone or part of the polar vortex, they are all cyclones with the lowest pressure found at their center. Extratropical cyclones are fascinating as they can often intensify into very large areas of energy on the planet. Sandy transitioned from a tropical to extratropical cyclone just before landfall. As Dr. Ryan Maue of WeatherBell Analytics states:
Rapidly intensifying maritime extratropical cyclones are characterized by Sanders and Gyakum (1980) as “meteorological bombs” if their central pressure dropped by a geostrophically adjusted 1 millibar per hour for a period of 24 hours. A warm-core seclusion is the mature stage of an intense marine extratropical cyclone typified by explosive deepening, strong surface winds, and thermally indirect inner-core mature structure as conceptualized within the Shapiro-Keyser and Norwegian cyclone lifecycle models.
You will hear me say a low is “bombing out” if it meets such criteria. A warm core seclusion is possible in any of Earth’s oceans.
High pressure, on the other hand, likes to organize into clockwise anti-cyclones. This is the direct opposite mechanism as a cyclone. You would blow bubbles through your straw into your drink from the high pressure you create in your mouth. Anticyclones feature sinking air (convergence at the upper levels and divergence at the lower levels) which generally create fair weather conditions. The clockwise flow around the center of the high also governs wind direction at the surface and air mass temperature movement.
You’ll hear me refer to the intensity of low and high pressure systems in millibars. Sea level pressure under neutral pressure conditions is about 1014mb. 1028mb is a weak high. 1050mb+ is a strong high. 1000mb is a weak low. 980mb or less is a strong low. Major NJ storm systems of the past, just for reference, have intensified below 980mb. Sandy was 946mb during landfall. The March 1993 snow storm was in the 960-970mb range. The lower the pressure in mb, the greater the winds around it and greater the storm system.
Ridge vs. Trough – A ridge is a large area of high pressure, usually with an anticyclone in its heart that likes to create an upside-down U-shaped wobble in the jet stream. Underneath this U generally tends to be warmer/drier weather conditions. In the summer, this is when we get a 80-85 degree day with clear blue skies. In the winter, this is when we bottom out with below-zero to single-digit temperatures and the clearest stargazing conditions possible. A trough is a large area of low pressure usually with a cyclone in its heart that likes to create a U-shaped wobble in the jet stream. Underneath this U generally tends to be cloudy conditions with precipitation and/or colder weather conditions in general. In the winter, this is our best chance for winter storms, especially on the bottom-eastern side of the trough where surface low pressure likes to intensify.
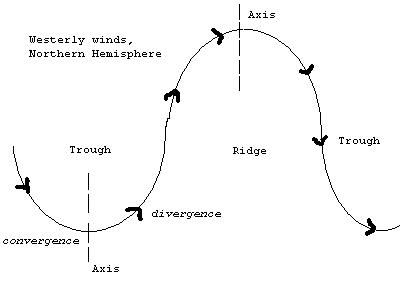
Troughs generally rotate from west to east just like the jet stream flow. Therefore, we experience various conditions at the front, middle and back of them. For example, the front of a ridge could bring colder northerly flow. While in the ridge, conditions are fairly calm. The back of the ridge is typically warmer from southerly flow and often precedes a frontal passage along the front of a trough. While in the trough, conditions are unsettled. The back of the trough returns the flow back to northerly as another ridge approaches. It doesn’t adhere to that exact level of regularity but you get the idea. Such northerly and southerly flow are determined by the cyclonic or anti-cyclonic circulation around a low or high.
Upper-Level Physics – While our conditions matter most to us on the surface, upper-level physics govern what happens on the surface. The primary upper-levels of concern are the jet stream level (250mb = ~34,000 feet) and the H5 level (500mb = ~18,000 feet). The jet stream level tells us the wobble configuration and the H5 level tells us the governing physics at the heart of each trough and ridge. I did take some pretty advanced Astronomy courses in my computer science education so I have a working knowledge of basic planetary physics. Surface lows can behave with upper-level lows as approaching meteors do with planets.
Ultimately an upper low will try to pull a surface low to its center to become fully stacked. This is when big storms blow up. Sometimes, the surface low isn’t pulled in enough (the meteor misses the planet). Such an outcome can have catastrophic forecast busting associated with it. You’ll see me paying great attention to this detail this winter as it is the ultimate probability indicator for big systems. So upper-level physics have a huge role and they arrange themselves in natural teleconnection patterns around the planet.
So what are teleconnections? – The Earth’s surface is 71% water. Water and land heat and cool at different rates as Earth rotisseries it’s surface under the sun’s radiation via revolution within planetary orbit. These different rates of heating and cooling are always trying to equalize through thermodynamics. While this creates a perfect atmosphere of chaos, some hydrospheric patterns can be clearly observed as oscillating anomalies over time. Some can oscillate within their respective polar ranges over weeks and months while others can take years or even decades. Regardless, these oscillations can both visually define and predict jet stream behavior which steers synoptic mid-latitude cyclones and ultimately defines our mesoscale surface weather conditions. So from west to east, let’s talk about the teleconnections that I monitor for our larger region, the mid-Atlantic and NE US.
ENSO (El Niño Southern Oscillation) – ENSO is one of the most important climate phenomena on Earth due to its ability to change the global atmospheric circulation, which in turn, influences temperature and precipitation across the globe (NOAA Climate.gov). There are 2 states of the ENSO however the anomaly can be measured in the gray area (often it can remain neutral or in-transition for extended periods of time). Typically the time scale of El Nino-La Nina is 3-7 years (Australian Government Bureau of Meteorology).
The first state is El Nino. This occurs when SST (sea surface temperatures) are warmer than average in the central-eastern Pacific Ocean along the equator. El Nino is west-based if the warmest SST anomalies are closer to the central Pacific and east-based if the warmest SST anomalies are closer to W. South America. El Nino typically results in warmer winter temperatures because the polar and subtropical jet stream are separated until east of us in the Atlantic Ocean. This allows the mild air between the streams to dominate the pattern with less polar influence. The following image shows an El Nino SSTA signature.
The second state is La Nina. This occurs when SST are colder than average in the central-eastern Pacific Ocean along the equator. Warmer SST are found closer to Indonesia and Australia. La Nina can also be west or east-based. La Nina typically results in greater fluctuations of winter temperatures and a more active storm pattern because the jet streams have the potential to phase either over us or to the west of us coming off the Pacific Ocean. The following image shows the current state of the ENSO, a weak La Nina.
Major snow storms can occur in either ENSO oscillation. This past winter was overall warm and mild in El Nino fashion. But look at the storm we saw in late-January.
PDO (Pacific Decadal Oscillation) – According to the State Climate Office of South Carolina:
The Pacific Decadal Oscillation (PDO) is a pattern of Pacific climate variability similar to ENSO in character, but which varies over a much longer time scale. The PDO can remain in the same phase for 20 to 30 years, while ENSO cycles typically only last 6 to 18 months. The PDO, like ENSO, consists of a warm and cool phase which alters upper level atmospheric winds. Shifts in the PDO phase can have significant implications for global climate, affecting Pacific and Atlantic hurricane activity, droughts and flooding around the Pacific basin, the productivity of marine ecosystems, and global land temperature patterns. Experts also believe the PDO can intensify or diminish the impacts of ENSO according to its phase. If both ENSO and the PDO are in the same phase, it is believed that El Niño/La Nina impacts may be magnified. Conversely, if ENSO and the PDO are out of phase, it has been proposed that they may offset one another, preventing “true” ENSO impacts from occurring.
The following image shows a negative-phase PDO which typically accompanies an El Nino. A positive phase PDO would be the reverse of this image, with above-average temperature anomalies in the central northern Pacific…just like the current ENSO state image above.
The PDO can have tremendous impact on North American weather conditions. We’re watching this closely as the EPAWA 2016-2017 Winter Outlook points out.
EPO (Eastern Pacific Oscillation) – The EPO is a much shorter-term oscillation. It can flip between its positive and negative phase in a matter of weeks to months. Basically, the positive phase represents a ridge in the NE Pacific (near the Bering Sea/Alaska). This ridge then results in a trough downstream over the W. US and a ridge over E. US, making for warmer temperatures in our region. The negative phase of the EPO represents a trough for the Bering Sea/Alaska area and ridge for the W. US, often assisting the positive phase of the PNA (we’ll talk about that next) in creating warmer temperatures for the W. US. This then creates a trough for the central/E. US which again, means colder temperatures and more active winter weather conditions for our region.
PNA (Pacific North American Oscillation) – The PNA is closely linked to the EPO in the sense of typically wanting to be its opposite. While not always the case, since its the next-east oscillation of the EPO downstream, it likes to mirror the jet stream behavior in reciprocal fashion. For example, when the EPO is negative, the PNA likes to go positive and vice-versa. Simple physics…think of waggling a rope on the ground and the waves you create from doing such. These are similar principals in wave behavior. The negative phase of the PNA means a trough over the W. US and likely then a ridge in the E. US. The positive phase of the PNA means a ridge over the W. US and a trough over the E. US.
AO (Arctic Oscillation) – Moving eastward we arrive at the AO. According to Meteorologist Jeff Masters of Weather Underground:
The Arctic Oscillation (AO) is a pattern of varying pressure and winds over the Northern Hemisphere that can strongly influence mid-latitude weather patterns. When the AO is in its positive phase, jet stream winds are strong and the jet stream tends to blow mostly west to east, with low-amplitude waves (troughs and ridges.) Since the jet stream marks the boundary between cold Arctic air to the north and warm subtropical air to the south, cold air stays bottled up in the Arctic. When the AO is in its negative phase, the winds of the jet stream slow down, allowing the jet to take on more wavy pattern with high-amplitude troughs and ridges. High amplitude troughs typically set up over the Eastern U.S. and Western Europe during negative AO episodes, allowing cold air to spill southwards in those regions and create unusually cold weather.
So what snow lovers want to see is a slight-to-moderate negative AO. This means the jet stream has relaxed enough to let cold Arctic air spill southward over the E. US. We saw this big time in the second half of winter 2013-2014. We also saw it last winter a few times. This produces the true cold air needed to fuel large snow storms for our region. The AO can actually go too-negative for snow lovers which can result in precipitation suppressed to the south with simply cold air over our region.
NAO (North American Oscillation) – The last oscillation I will talk about is the NAO. For our terms and purposes this winter, a negative NAO means cold active weather vs. a positive NAO meaning warm and inactive weather. During the negative phase, high pressure blocking forms over the Greenland/N. Atlantic area. This forces the jet stream to bubble and dip over the E. US in the form of a trough. When coupled with a -AO, the result is a favorable pattern for a east coast winter storm. High latitude blocking during a -NAO will also slow a storm system down, allowing for increased total precipitation and time to intensify. The positive phase means less of a meridional jet stream pattern over eastern North America which doesn’t push down a trough. Instead it keeps the east coast slightly warmer while allowing any storm systems crossing the US to progressively race east out to sea, unobstructed. Smaller snow events are still possible with a positive NAO but major snow accumulations are less likely. A -NAO can be east or west-based which can also have significant role in storm track (Great Lakes vs. coastal). Sometimes when a low positions itself over the geographic coordinates of 50N/-50W, it can form a block and slow storm systems down the same way that blocking over Greenland would. This is more of a “thread the needle” situation but it’s a fascinating coincidence when it happens.
Teleconnection Summary – All of the above oscillations work together as the jet stream does its thing. The ideal pattern to look for, for a major east coast snow storm, is a -EPO/+PNA/-AO/-NAO. Obviously decent snow storms can still happen under less ideal setups but it puts people like me on the edge of our seat when they all show together. You’ll hear me refer to these teleconnections throughout the winter when analyzing whether or not model guidance supports the current pattern.
Siberian Snow Cover – This is not a fail-safe indicator but typically when Siberian snow cover is above average during October/November, it can result in cross polar flow if a negative AO sets up. As of right now, Siberian snow cover is measuring a top-5 historic amount so we’ll get to see exactly what it means we start seeing longer and more potent cold snaps heading into December.
Influence of Typhoons – Every long-range forecaster’s nightmare! When typhoons in the W. Pacific fail to make landfall on E. Asia and instead curve northward towards the Bering Sea, they have a tremendous impact downstream for the continental US. The cyclonic nature of a typhoon curving northward creates a ridge in the E. Pacific/W. US which translates to a cold trough in the E. US. We saw this several times over the past winters, including last November. The downstream impacts tend to occur a few weeks or so after the curve. This is another thing I’ll be watching out for upstream.
Types of East Coast Winter Storms and Snowfall – Here on the east coast, we typically see snowfall from a few different scenarios:
Miller-A – Miller-A systems generally originate near or in the Gulf of Mexico. The low tracks across the SE US and ejects into the Atlantic Ocean somewhere between say Georgia and Virginia. It then tracks near what we call the benchmark (the BM) which is a geographic location of 40N -70W (just south of E. Long Island). This is an ideal track for a New Jersey snow storm. If the low tracks inside of the BM (NE of it), New Jersey sees more rain than snow. If the low tracks outside of the BM (SE of it) then it can result in a miss out to sea or SENJ-only snow. The March 1993 snow storm was a classic Miller-A.
Miller-B – Miller-B systems often come onshore off the Pacific Ocean and/or generally approach from our west. They transfer energy to another low that can take a BM-like track. During the transfer, enormous dry slots of precipitation can occur that can majorly bust forecasts. Once the transfer is complete, if the low hangs around long enough, it can result in a major snow storm. The President’s Day Weekend snow storm of 2003 was a classic Miller-B.
Clipper – Clipper are systems that originate in SW interior Canada (often called Alberta Clippers). They dip southward enough to get caught in the polar jet stream and get shot eastward along the US/Canadian border and over the Great Lakes. These systems are often cold systems and are known for very light/powdery snow. Clippers are generally moisture-starved but the colder environment allows for higher snow ratios (inches of snow to inches of rain). They are notorious for putting down a quick coating to a few inches of snow that instantly sticks. This can often result in quick travel surprises. Most clippers usually move through the area pretty quickly however sometimes they can transfer (in a Miller-B fashion) to a coastal low for a larger snowfall total.
Lake Effect Snow – Whenever a strong W/NW, NW or N/NW flow occurs over the Great Lakes (as long as they are unfrozen – just outside of core winter months), snow showers can form to the E/SE, SE or S/SE of them. These snow showers can hold together all the way to the Atlantic Ocean (over New Jersey). Sometimes you will hear them referred to as a flizzard when they hit. They can lead to very brief white-out conditions in New Jersey with little to no accumulation (dustings most common) but can stack up to feet of snow in places like Buffalo/Syracuse, NY.
Ice Storm – Sometimes winter storms start out as snow but warmer air invades the mid-levels. This can happen when a low tracks too far west but imposes upon an existing colder air mass in place. Precipitation starts out as rain at the strongest levels of warm air advection then changes to sleet before hitting the ground or hits the ground and freezes as freezing rain. Sometimes you will hear a term called cold air damming. For example, the appalacian mountains can lock the colder air mass in place at the surface and allow the warmer air to pass overhead—at a high enough elevation to result in all snow at the surface. I’ll point this out if/when it happens this winter. Again, it’s when a warm storm invades a cold air mass over us.
Wind Direction – As a low passes by, it’s important to note the change in wind direction. If a low is to our south, it’s counter-clockwise flow will produce easterly winds off the above-freezing Atlantic Ocean. This will prevent snow from occurring most of the time. It won’t be until the low is SE or E of us to change the wind direction to N/NE, allowing colder air to change rain over to snow. We deal with this a lot on the coast and it’s often frustrating for the snow lover. This is not an issue for clippers and lake effect snow because in those cases, the wind flow is generally out of the NW—tapping colder, Canadian, polar or Arctic air. This is an issue for Miller-A and Miller-B events that take a coastal storm track.
Model Guidance – The models are not preaching gospel. They are producing guidance. Their output are the result of super-computer calculations based on current atmospheric measurements at runtime. It is best to use their overall consensus and look at live observations as well as the current overall pattern. Does the pattern support it or not? If no then we’ll likely watch it disappear of guidance. If yes then we’ll pursue accordingly. I like to monitor the European (ECMWF), American (GFS), Canadian (GGEM) and UKMET in the mid-to-long range. In the short range, I like to monitor the 12km NAM and Canadian (RGEM). In the ultra short-range, I like to use the HRRR. There are a few others and model technology is always incrementally upgrading through better super-computers.
Timing is where it can get confusing. Models are based on zulu time. The 00Z run is midnight, 06Z is 6AM, 12Z is noon and 18Z is 6pm in Greenwich Mean Time (at 0 degrees of longitude). To convert to our time you subtract 4 or 5 hours depending on which side of daylight saving we are. We just moved into EST so it’s minus 5 until March. That means that 00Z is actually 7PM on the east coast. What you need to know is that the 00Z runs populate during overnight hours while 12Z runs populate during daytime hours. 06Z and 18Z runs happen in between but feature less data input than the 00Z and 12Z runs.
How I will track winter storms – By now it should be clear that social meteorology is not about “who posted first about the storm system.” Big storm systems show up on long-range model guidance all the time only to disappear in the mid-range. Even though I obsessively monitor model guidance out to two weeks, I likely will only start discussing possibilities if A) They are showing on multiple models in the long range and B) The current pattern supports such an event happening. And just because I discuss the possibility does not mean I am forecasting it to happen. I will discuss the system so long as it stays on consensual guidance into the mid-range. Once mid-range guidance transitions into short-range guidance, with the system still showing, I will begin making snowfall accumulation maps in collaboration with EPAWA. You will likely see an initial thoughts map 3 days before the storm’s impact, several updated thoughts maps 2-1 days out, and a final map the day of the approaching storm system. This is the strategy that we’ve found to be most effective over the years of delivering forecasts to the public. It allows us to narrow possibilities over time but gives you an idea of what to expect (best vs. worst case scenario). Again, it’s not about being first, it’s about being accurate while narrowing the realm of total possibilities over time.
In English – I hope you found this primer helpful. Weather NJ (formerly Severe NJ Weather) will be turning 7 this coming February. It has been an absolute honor to forecast and aggregate safety awareness over the years through educational understanding. Again, if you want to see our predictive outlook for this coming winter, head on over to the EPAWA 2016-2017 Winter Outlook. Otherwise, please be safe! JC
References
Australian Government Bureau of Meteorology
Martrich, Bobby. Eastern PA Weather Authority Chief Meteorologist
Masters, Jeff. PhD (Meteorologist). Weather Underground
Maue, Ryan. PhD (Meteorologist). Warm Seclusion Extratropical Cyclones. Florida State University
Image Credit
Reed Wurst in the pine barrens by Ben Wurst of Reclaimed
Jonathan Carr (JC) is the founder and sole operator of Weather NJ, New Jersey’s largest independent weather reporting agency. Since 2010, Jonathan has provided weather safety discussion and forecasting services for New Jersey and surrounding areas through the web and social media. Originally branded as Severe NJ Weather (before 2014), Weather NJ is proud to bring you accurate and responsible forecast discussion ahead of high-stakes weather scenarios that impact this great garden state of ours. All Weather. All New Jersey.™ Be safe! JC


LOCAL FORECAST | INTERACTIVE RADAR | LATEST NJ WEATHER ALERTS | WEDDING FORECAST| PRIVACY POLICY
© Copyright 2026 Weather NJ LLC. All Rights Reserved.
Some information that can be found on our website is provided by a private weather station and is not an officially recognized station for weather reporting. Though we always strive to achieve accurate reporting for our own use, it is important that you do NOT depend on the data provided here for any purpose.
