

What to Expect for January 2016

It’s time to harness the WeatherTrends360 proprietary weather algorithms for an early peek at how January plays out. But first lets break New Jersey into proper climatological regions. We have the higher elevations of NNJ/NWNJ, the interior coastal plain (SWNJ through CNJ and into NENJ), and the coastal regions (most of SENJ). I’ll be representing each climatological region with a 28-day graph from weathertrends360 data followed by a brief discussion. Please keep in mind that these algorithms are documented with an 84% verification rate and are based on oceanic water cycles and time table series.
Higher Elevations of NNJ/NWNJ
(Sussex, Warren, Hunterdon, Morris, N. Somerset, and N. Passaic) – Known for little to no Atlantic Ocean influence, colder-snowier winters, and drier conditions in general when compared to the coast. This region is known to get hot when high pressure sits overhead during the summer and bitterly cold during Arctic outbreaks in the winter.
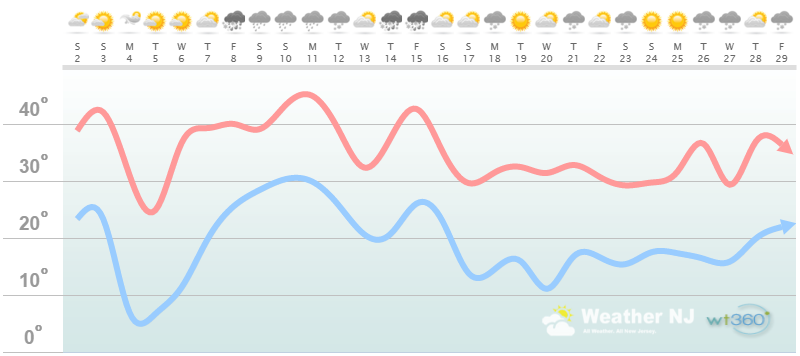
Higher Elevation Discussion: January starts colder thanks to the anomaly created from polar vortex displacement—which was the result of that superstorm a few days ago in the northern Atlantic bringing a transient warm front over the north pole. Aside from that, temperatures should slowly drop through the first half of January before bottoming out in a noticeably sustained colder pattern for the second half. For this region, that means just a few more days here and there where highs reach into the 40s. The storm signal in the Jan 8-12 is very much alive but we’re still a few days away from specific threat analysis. The bottom line for this region is that January will be slightly colder than average overall with slightly above-average precipitation.
Interior Coastal Plain from SWNJ-CNJ-NENJ
(Salem, Gloucester, Camden, W. Burlington, Mercer, W. Monmouth, Middlesex, S. Somerset, Union, Essex, Hudson, Bergen, and S. Passaic) – Known for naturally higher temperatures due to lower elevations away from the oceanic influence. This region is also known as “heat island” due to transportation (I-95 corridor), smog, abundant asphalt, concrete, and other man-made substances that naturally absorb and retain heat moreso than natural protected land.
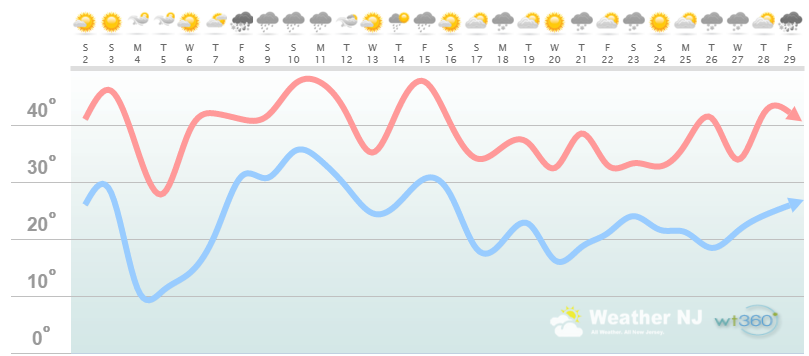
Interior Coastal Plain Discussion: January starts colder thanks to the anomaly created from polar vortex displacement—which was the result of that superstorm a few days ago in the northern Atlantic bringing a transient warm front over the north pole. Aside from that, temperatures should slowly drop through the first half of January before bottoming out in a noticeably sustained colder pattern for the second half. For this region, that means highs in the 30s/40s (first half of Jan) then highs mostly in the 30s (second half). As you can see, lows look to be in the teens and 20s as we close out the month. The storm signal in the Jan 8-12 is very much alive but we’re still a few days away from specific threat analysis. The bottom line for this region is that January will be slightly colder than average overall with slightly above-average precipitation.
Coastal Regions of SENJ
(Cumberland, Cape May, Atlantic, E. Burlington, Ocean, and E. Monmouth) – Known for tremendous influence from the Atlantic Ocean. Oceanic influence keeps this zone cooler in the summer and warmer in the winter than the interior coastal plain and especially the higher elevations of NWNJ. This forms a micro-climate that only local inhabitants and frequent visitors are familiar with.
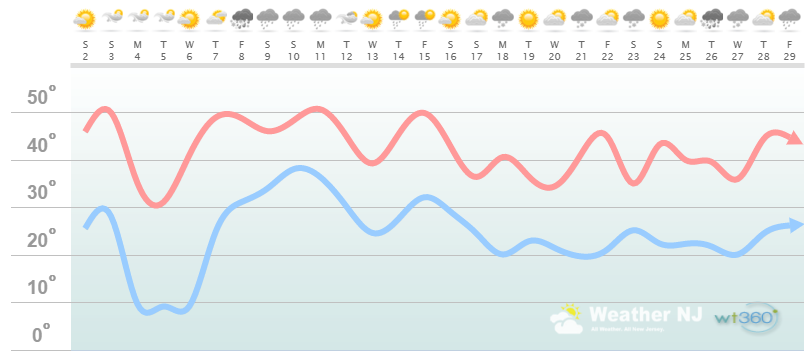
Coastal Region Discussion: January starts colder thanks to the anomaly created from polar vortex displacement—which was the result of that superstorm a few days ago in the northern Atlantic bringing a transient warm front over the north pole. Aside from that, temperatures should slowly drop through the first half of January before bottoming out in a noticeably sustained colder pattern for the second half. For this region, that means just a few more days here and there where highs reach into the 50s. Once the month turns even colder for the second half, highs should stay in the 30s/40s with lows dropping to about ~20 (give or take a few degrees). The storm signal in the Jan 8-12 is very much alive but we’re still a few days away from specific threat analysis. The bottom line for this region is that January will be slightly colder than average overall with slightly above-average precipitation.
Summary: Based on the data from Weathertrends 360 and the general pattern I see through the long-range forecasting period, I think we’re looking at conditions/temperatures which are seasonably average to slightly below-average for January. Being the coldest month of the year, that will still be cold enough for several wintry weather opportunities that should come along. Precipitation looks to be slightly above average due to the onslaught of energy coming off the Pacific Ocean in a split flow pattern. Let’s see what storm threats emerge in the Jan 8-12 period.
El Nino’s traditional warming impacts on the E. US (like in November and December) will now be less significant with the way the pattern is unfolding. The high pressure ridge off the SE. US that has been providing the warmth is now squashed and cut off by the trough that came out of Canada (again, assisted by the PV displacement from superstorm). We now have ridging in the W. US which will support the troughing in the E. US. Storm threats will now be determined by blocking availability and the merging of energy between the split jet flow pattern.
In English: A very cold start to January (Arctic blast peaks this Monday-Tuesday). Temperatures should then moderate slightly Wednesday into the weekend as the storm signal for Jan 8-12 continues to be monitored. The second half of January should then settle into a sustainable colder pattern. Stay warm and be safe! JC
Weathertrends360 is a complete, global, web solution to help retailers and suppliers capitalize on the weather and its influence on sales and marketing plans up to a year ahead. Learn how to become PROACTIVE vs REACTIVE with the weather in every phase of your business – how much inventory to buy/produce, where to allocate more/less, when to run weather-optimized advertising/marketing campaigns – weathertrends360 can help you determine all of this in minutes! 84% independently audited accuracy for both short-term and year-ahead forecasts for temperature and precipitation.
A forecast Weather Trends issued one year ago is more accurate than every other weather company’s 5 to 14-day forecasts. The University of Miami and West Point PhD Climatologist’s prove WTI’s year-ahead forecasts are several times more accurate than NOAA – Click to Download Report. Also check out their free txt and email alerts!
Jonathan Carr (JC) is the founder and sole operator of Weather NJ, New Jersey’s largest independent weather reporting agency. Since 2010, Jonathan has provided weather safety discussion and forecasting services for New Jersey and surrounding areas through the web and social media. Originally branded as Severe NJ Weather (before 2014), Weather NJ is proud to bring you accurate and responsible forecast discussion ahead of high-stakes weather scenarios that impact this great garden state of ours. All Weather. All New Jersey.™ Be safe! JC


LOCAL FORECAST | INTERACTIVE RADAR | LATEST NJ WEATHER ALERTS | WEDDING FORECAST| PRIVACY POLICY
© Copyright 2026 Weather NJ LLC. All Rights Reserved.
Some information that can be found on our website is provided by a private weather station and is not an officially recognized station for weather reporting. Though we always strive to achieve accurate reporting for our own use, it is important that you do NOT depend on the data provided here for any purpose.
